01RIP-01
River buffer width
Is every river buffered to 30 m? Where it isn't, we pin the exact location.
30 m requirementGaps located
Plantation 12 m from river / min 30 m
09.6471° N, 084.0213° W
Segment 14 · 180 m of bank
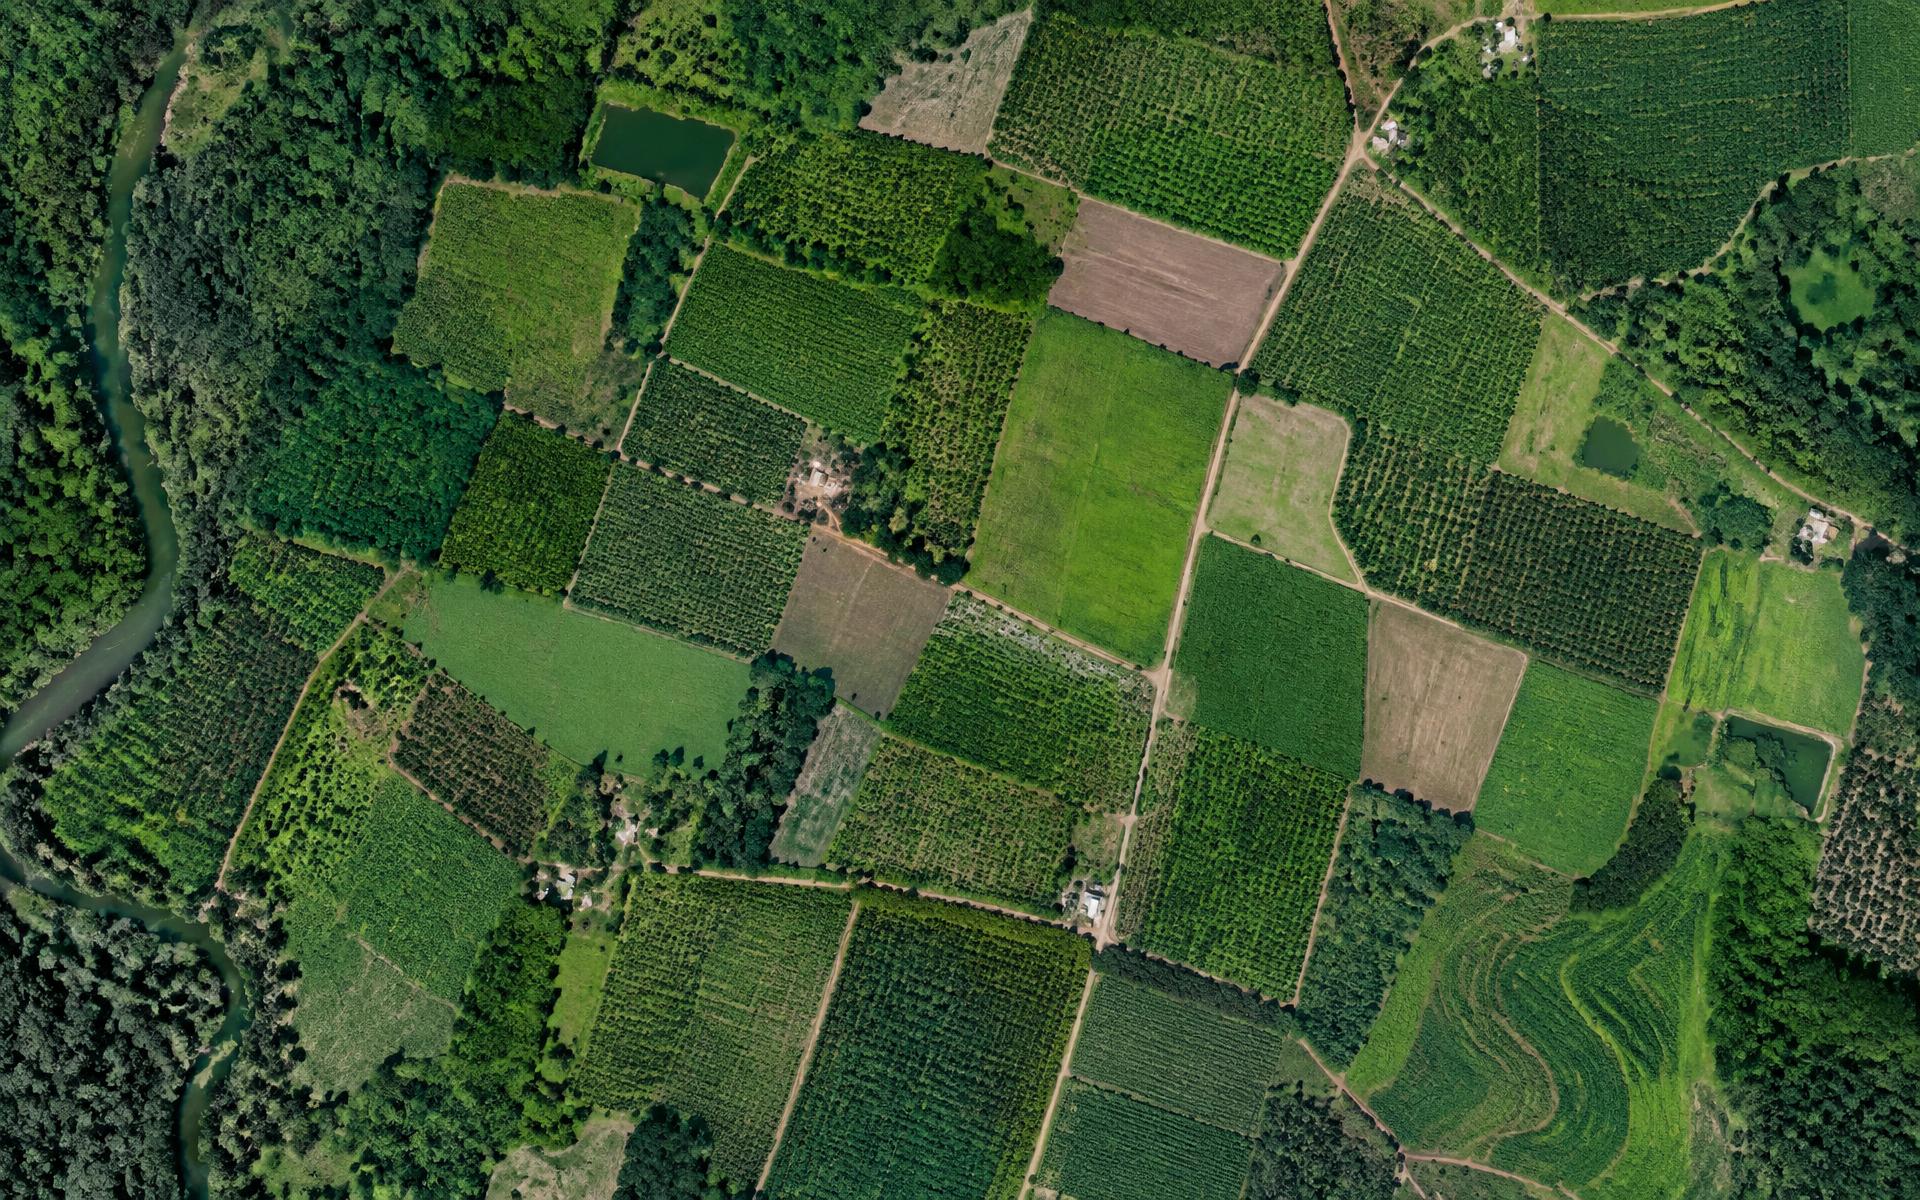
HD satellite imagery / 15 cm + 30 cm
The one-stop platform for tropical food companies to locate & prove every farm meets EUDR, Rainforest Alliance and Fairtrade requirements, from 15 cm HD satellite imagery.
See the detailTrusted by global food companies and space partners





01 / The Biota edge
Our machine-learning models are trained and run only on 15 cm and 30 cm commercial satellite imagery. Most tools rely on free Sentinel-2 data at 10 m.
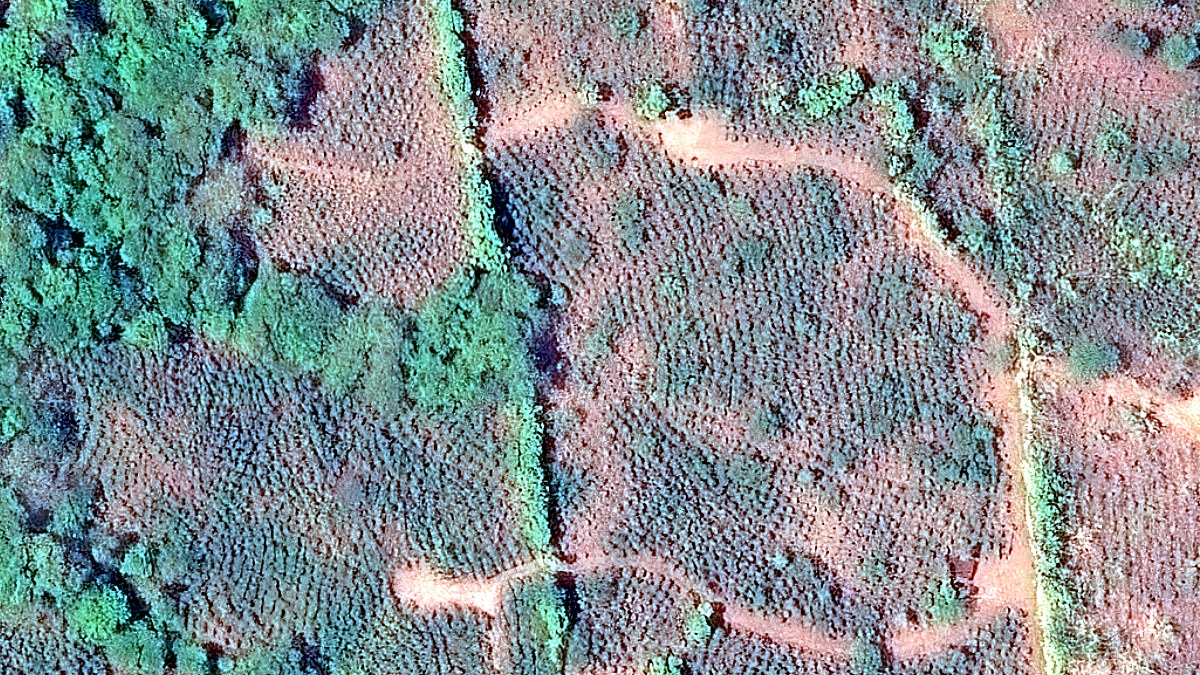 3,726 coffee crowns detectedBiota
15 cm
Every coffee bush. Every tree crown.
 Open-source Sentinel-2
10 m
Fields only.
Up to 67× finer detail than Sentinel-2
Same Costa Rican coffee farm · 15 cm image resampled to Sentinel-2’s 10 m
02 / Core models
Satellite imagery + terrain models + machine learning
Is every river buffered to 30 m? Where it isn't, we pin the exact location.
Plantation 12 m from river / min 30 m
09.6471° N, 084.0213° W
Segment 14 · 180 m of bank
Forest loss and canopy thinning, detected at 30 cm resolution across repeat passes.
Whether habitat links into continuous corridors, or breaks apart.
Analyses flow patterns and the resulting runoff risk from fertiliser loading.
Condition, density and core area, graded on five classes.
How much of the coffee grows under shade, measured crown by crown.
Shade cools the crop, protects soil and shelters wildlife. 40% cover is the shade-grown benchmark.
03 / Standards
Farm-by-farm evidence for EUDR, Rainforest Alliance and Fairtrade. Every row is primary data, measured directly from 15 cm imagery.
| Biota evidence | EUDR | Rainforest Alliance | Fairtrade |
|---|---|---|---|
Plot boundaries & geolocation Polygons for every plot, from HD imagery | |||
Deforestation & land-use change Change detection against cut-off dates | |||
River buffers Vegetation width along every waterway | — | ||
Habitat quality & connectivity Natural ecosystems, cores and corridors | — | ||
Slope & erosion risk Steep ground draining toward water | — | ||
Shade-tree canopy Canopy cover over coffee and cocoa | — | — |
Biota provides geospatial evidence for due diligence and audits; compliance and certification decisions rest with the competent authority or certifying body. EUDR covers coffee and cocoa, not banana or pineapple. Standard names are trademarks of their owners; Biota is independent.
Reporting-ready data
The same farm evidence feeds sustainability reporting



04 / Crop systems
20,000+
15 cm images of tropical landscapes, captured over the last 3 years, train our models.
Commodities covered
Coffee
Cocoa
Banana
Pineapple
Forestry